
The question
India now has a name for its creative economy, but no size. The Economic Survey 2025-26 gave the orange economy its first official working definition: activity in which value comes mainly from creativity, culture and intellectual property rather than physical goods. The Union Budget 2026-27 then funded AVGC Content Creator Labs in 15,000 schools and 500 colleges. Yet no official statistic says what the sector produces, how many people it employs, or whether it is growing. This project asks three linked questions. What should India count as its orange economy? How should it be counted? And which institution should own the count?
Why other countries count it
The term ‘orange economy’ was popularised by the Inter-American Development Bank in 2013, and a growing number of countries now treat the sector as a measurable part of their economies. UNESCO estimates that cultural and creative industries generate about US$2.3 trillion in annual revenue, roughly 3.1% of world GDP, and account for 6.2% of global employment. Among the 36 mainly developing economies surveyed for UNCTAD’s Creative Economy Outlook 2024, the sector’s share ranges from 0.5% to 7.3% of GDP and from 0.5% to 12.5% of employment, and more than 70% of countries now have a national plan, strategy or policy for it. Trade explains much of the interest: world exports of creative services reached about US$1.7 trillion in 2024, a fifth of all services trade, and creative goods added a further US$709 billion (UNCTADstat).
Countries that count the sector use the number to steer it. The United Kingdom publishes accredited official estimates every year: its creative industries contributed £124.0 billion, or 5.2% of gross value added, in 2023. Indonesia has a dedicated Ministry of Creative Economy and writes targets for the sector into its national development plan; the sector produced 7.28% of GDP in 2024 and employed 27.4 million people, 18.7% of all workers, in 2025, and creative exports in the first ten months of 2025 had already passed the year’s target. South Korea tracks its content industry as an export sector, with record exports of US$14.08 billion in 2024, led by games. Colombia, which wrote the orange economy into law in 2017, runs a cultural and creative satellite account; it shows the sector averaging about 3% of national value added over 2014-2023 and providing 3.7% of jobs in 2023.
What India is missing is not creative activity but a ledger for it. UNCTADstat ranks India fourth in the world for creative services exports, at US$102 billion in 2024, though, as discussed below, that figure includes software and R&D. India also produces about 29% of the world’s feature films by volume. Yet unlike the United Kingdom, Indonesia or Colombia, it has no official measure of the sector’s value added, no regular employment series and no targets against which to judge programmes such as the AVGC labs. It cannot yet say whether public money is creating creative jobs, where those jobs are, or how its sector compares with those of its peers.
What we know
The evidence is plentiful but scattered, and each piece measures something different. The most recent and comprehensive estimate is ICRIER’s Working Paper 437, published in August 2026. It maps UNESCO and EU cultural domains onto India’s National Industrial Classification and applies them to unit-level Periodic Labour Force Survey (PLFS) data. Based on this, about 57 million people worked in the culture-creative economy in 2025. That is nearly 9% of the national workforce and 16.7% of all urban employment, up 40% from 40.6 million in 2017-18. Female employment in the sector doubled over the same period. The government has begun to quote this figure: in September 2026, the Minister of State for Information and Broadcasting cited 57 million Indians in cultural and creative occupations.
What the 57 million is made of
The headline hides very different kinds of work. Half of the 57 million (28.8 million, or 50.4%) make crafts and design goods such as clothing, jewellery and handicrafts; custom tailoring alone employs about 11 million people. Another 23.2 million (40.7%) fall under ‘culture and natural heritage’, a broad category that in ICRIER’s framework covers traditional foods and recipes, festivals, and religious and heritage tourism as well as museums and historical sites. Across all sectors, the largest cultural industries after clothing are the retailing of traditional foods and sweets (15.4% of cultural workers) and tea shops and ethnic restaurants (15.0%). The creative services usually associated with the orange economy are small. Audio-visual, multimedia and photography employ 2.3 million people (4.0%), music and the performing and visual arts 1.3 million (2.2%), and design, architecture, books and advertising together about 1.5 million (2.6%). Half of all these workers are in manufacturing, and fewer than 5% are in creation and production.
Men make up 66% of the workforce (38.2 million) and women 34% (18.8 million), up from 23% in 2017-18; custom tailoring accounts for about half of the growth in women’s jobs. Some 68% of women in the sector work in manufacturing, against 40% of men. About 52% of the workforce is urban: 55% of men but only 46% of women, so creative work remains an important livelihood for rural women (Figure 1).
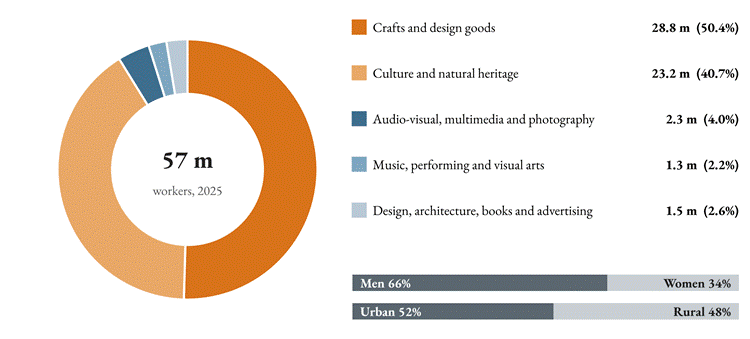
Figure 1. Composition of India’s cultural and creative workforce, 2025, by sector, sex and location. Source: ICRIER Working Paper 437 (2026), Tables 3 and A2, from PLFS 2025.
An earlier ICRIER study (2022), using an occupation-based method, put creative work at nearly 8% of employment. It found that creative occupations pay about 88% more than non-creative ones, and that six of India’s ten most creative districts are non-metros: Badgam, Panipat, Imphal, Sant Ravi Das Nagar, Thane and Tiruppur. Official craft data add depth. The Ministry of Textiles estimates 64.66 lakh handloom and handicraft artisans, and reports that women make up 64% of artisans and 71% of handloom weavers.
Industry and trade figures sit alongside these. The FICCI-EY report of March 2026 puts media and entertainment revenue at ₹2.78 trillion in 2025, up 9%. In trade, UNCTADstat values India’s creative services exports at about US$102 billion in 2024, fourth in the world behind Ireland, the United States and the United Kingdom.
What we do not know
None of these figures can be added to or compared with another, because each rests on a different definition. This is the central measurement problem, and the differences run along four lines.
- What is measured. The estimates count different things: people in work (ICRIER), ‘livelihoods’ including indirect ones (the I&B Ministry), gross value added (Esya Centre), industry revenue (FICCI-EY) or exports (UNCTAD). Revenue counts the full value of sales, including inputs bought from other firms, so it is always larger than value added. Livelihoods include jobs supported along the supply chain, so they are larger than direct employment.
- Which activities are in scope. WIPO’s copyright-industries method centres on activities that create and distribute copyrighted works, such as publishing, film, music and software. UNESCO’s framework adds cultural domains such as crafts, heritage, festivals and design. UNCTAD’s trade definition takes in software and R&D services. A handloom weaver in Panipat is therefore counted by ICRIER but largely missed by Esya, while a software engineer in Bengaluru adds to UNCTAD’s total but not to FICCI-EY’s.
- Who is covered. PLFS is a household survey, so it captures home-based, self-employed and casual workers. Enterprise-based and industry estimates miss many of them, and in a sector dominated by informal work that gap is large.
- When. The reference years run from 2016-17 to 2025, a period in which streaming, gaming and the creator economy grew rapidly.
UNCTAD itself cautions that national figures are not directly comparable for these reasons. Table 1 sets out the main Indian estimates side by side.
| Source | What it counts | Scope | Year | Figure |
| ICRIER WP 437 | Workers (PLFS) | UNESCO and EU domains mapped to NIC; formal and informal | 2025 | ~57 million |
| ICRIER (2022) | Share of employment | Creative occupations | 2022 study | ~8% |
| Esya Centre | Gross value added; workers | WIPO copyright industries; formal sector | 2016-17 | ₹888.89 bn (0.58% of GDP); ~1.1 million employees |
| I&B Ministry | Livelihoods; GDP contribution | Not stated | 2025 | 10 million+; ~₹3 lakh crore |
| FICCI-EY | Industry revenue | Media and entertainment | 2025 | ₹2.78 trillion |
| UNCTADstat | Creative services exports | Includes software and R&D | 2024 | US$102 bn |
Table 1. India’s orange economy estimates, by what each one measures. The figures are not additive and should not be read as a trend.
The Esya Centre applied WIPO’s copyright-industries method to 2016-17 data. It estimated gross value added at ₹888.89 billion, or 0.58% of GDP, with roughly 1.1 million workers, compared with an international average of 5.48%. Its authors acknowledge that the informal economy falls outside the method’s scope. UNCTAD’s US$102 billion sits at the other extreme, because its definition counts software and R&D services. In 2022, those two categories made up 41.3% and 30.7% of global creative services exports, respectively. FICCI-EY measures industry revenue, not value added.
Official statements add yet another view. The Secretary of the Ministry of Information and Broadcasting has described the creative economy as supporting over 10 million livelihoods and contributing about ₹3 lakh crore to GDP. Depending on the source, India’s creative workforce is about 1.1 million, 10 million or 57 million people (Figure 2a).
Even within a single sector, the choice of baseline and product codes changes the story. A PIB release of July 2026 reports toy exports (HSN 9503, 9504 and 9505) rising from US$152.7 million in 2017-18 to US$384.7 million in 2025-26, up 151.9%, and a trade deficit of US$213 million turning into a surplus of US$152 million. Measured from 2018-19, when exports were US$203.5 million, as a July 2026 Lok Sabha reply did, the same series grows by only about 89% (Figure 2b). A 2024 Rajya Sabha reply showed exports of HSN 9503 alone falling from US$177 million in 2021-22 to US$152 million in 2023-24.
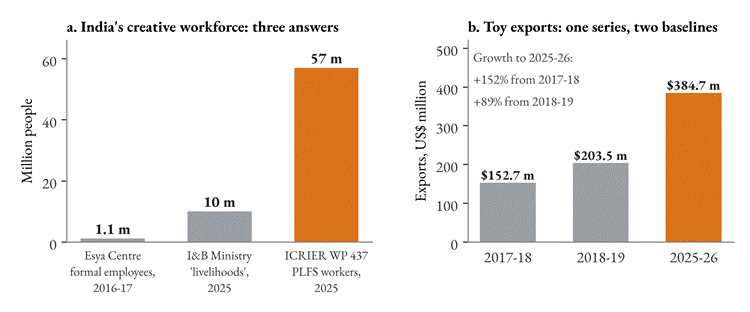
Figure 2. (a) Three estimates of India’s creative workforce, each on a different definition and year; they are shown side by side, not as a trend. (b) PIB toy export series (HSN 9503-9505): the growth rate depends on the base year. Sources: Esya Centre (2020); I&B Ministry (December 2025); ICRIER WP 437 (2026); PIB and Lok Sabha reply (July 2026).
What remains unknown, then, is the sector’s actual contribution to GDP, the value created by its informal workers, and whether rising employment means better livelihoods or simply more low-paid work. ICRIER’s 2026 paper finds employment concentrated in low-value manufacturing and women’s real wages stagnant.
What ASIA is examining
ASIA’s work on the orange economy is under way and will produce three linked outputs: a report on India’s creative economy, a book to be released around the next Union Budget, and a proposed conference on the orange economy. The report covers the sector’s main components, its economic contribution, and available statistics, and will form the foundation for the book. The Indira Gandhi National Centre for the Arts (IGNCA) is co-organising the conference. It is organised around four sub-themes: toys and handicrafts, films and theatre, gaming and audio-visual, and the economy of fests and festivals.
The research is guided by a set of open questions: what exactly the creative economy includes, how to measure it, whether the temple economy belongs within it, and which ministry should govern it. It also asks what policies already exist and where the gaps lie, how startups can strengthen the sector, and how traditional artists should be recognised and protected. Finally, it looks at which international models are worth adapting.
The first stage has been building the evidence base. The team is collecting and grading every available estimate by source type: government, statutory, and multilateral; industry bodies, think tanks, and academic papers; and news and aggregators, which are used only as leads until traced to a primary document. This process has already changed several figures in ASIA’s earlier drafts:
- Sector size. An often-cited size of about US$35 billion could not be traced to a primary source.
- Women artisans. The share of women among artisans has been updated from 62% to 64%, using PIB data from August 2025.
- Toy exports. Toy export figures now follow the July 2026 PIB series, which uses stated product codes.
- WAVES 2025. Its outcomes are now described as ₹1,328 crore of transactions plus ₹8,000 crore of memoranda of understanding, rather than as closed deals.
- Online gaming. Online gaming figures clash across sources because some include real-money gaming and others do not.
The second stage concerns method. ASIA’s measurement report recommends that MoSPI build an official Cultural and Creative Satellite Account. It would have three layers: a cultural core of crafts, handloom, performing arts, festivals, and heritage; the creative industries; and software and R&D, reported separately and never mixed into the headline figure. The account would draw on surveys India already runs, namely PLFS, ASUSE and ASI, along with trade data from DGCI&S and the RBI.
The report also sets written rules for difficult boundary cases. It would count festival crafts, music, and services, but not donations or general pilgrimage spending. The report would show figures for online gaming both with and without real-money games.
The report draws on other countries’ experience. It studies Colombia, the United States, Canada, the United Kingdom, Australia, and South Korea. Colombia is the closest model, because its statistics office counts micro-businesses, which contributed 12.4% of the sector’s value added in 2021-23. Based on this, the report proposes a three-year roadmap. The first phase would agree the definition and publish an experimental jobs estimate from PLFS. The second would build a first account and pilot it in states such as Maharashtra and Karnataka. The third would make annual publication routine.
Some work remains, and these gaps are themselves findings. No systematic economic data exists for Indian theatre or for folk forms such as Jatra. There is no reliable dataset on creative startups. The widely quoted temple-economy figure of ₹3.02 lakh crore has not yet been traced to its primary source. In the coming months, the team will:
- read the full FICCI-EY 2026 report and ICRIER Working Paper 437;
- extract the relevant chapters of the Economic Survey and the Budget speech;
- map state-level policies;
- finalise Indian case studies on branding and cultural value, including the Amul girl and a West Bengal HIV-awareness campaign.
All of this will feed into the book’s chapters on definitions, mapping, policy, creative workers and institutions, case studies, international comparisons and recommendations.
What would change if we knew the answer?
A single, annual, official figure would let India see whether creative growth is reaching women, informal workers and non-metro districts. It would give states with active AVGC-XR and toy policies a baseline to plan and evaluate against. It would also let India compare itself internationally on a like-for-like basis. Until such a figure exists, every estimate should be quoted with its source, year and definition.
METHOD / REPRODUCIBILITY
Method note: This analysis compiles existing estimates of India’s orange economy and does not produce a new one. We traced each figure to its original publication or official release and cross-checked it against at least one other source. Every estimate is reported with its year, unit and definition. Because the estimates use different definitions, scopes and years, they are compared side by side and never added together or read as a trend. We graded sources into three tiers: government, statutory, and multilateral; industry, think-tank, and academic; and news reports, which we used only as leads until we traced them to a primary document. We left out figures we could not trace to a primary source. International figures are used to compare measurement methods, not to rank countries.
Sources:
Indian government and official statistics
- Economic Survey 2025-26 and Union Budget 2026-27, Government of India
- PIB Research, Creative industries as growth engines (February 2026)
- Ministry of Statistics and Programme Implementation (MoSPI), National Industrial Classification 2025 (November 2025)
- Press Information Bureau: backgrounder on India’s toy ecosystem (July 2026); handloom and handicraft artisan data (December 2025); WAVES 2025 outcomes (May 2025)
- Rajya Sabha and Lok Sabha replies on toy exports (August 2024 and July 2026) and on handloom and handicraft artisans
- Secretary, Ministry of Information and Broadcasting, remarks at the CII Big Picture Summit (December 2025)
- Minister of State for Information and Broadcasting, remarks at the Jindal Policy Conclave (September 2026)
Research and industry studies
- ICRIER Working Paper 437, Estimating Employment in India’s Cultural and Creative Economy: Evidence from the Periodic Labour Force Survey (August 2026)
- ICRIER/ADBI, Creative India: Tapping the Full Potential (2022)
- Esya Centre, Measuring India’s Creative Economy (2020)
- FICCI-EY, Stories, Scale and Impact: Unlocking India’s Media and Entertainment Economy (March 2026)
- Inter-American Development Bank, The Orange Economy: An Infinite Opportunity (2013)
Multilateral sources
- UNCTAD, Creative Economy Outlook 2024
- UNCTADstat, creative goods and services trade data (updated April 2026)
- UNESCO, Framework for Cultural Statistics (2009)
National statistics from other countries
South Korea: Ministry of Culture, Sports and Tourism, content industry survey (February 2026)
Colombia: DANE, Cultural and Creative Economy Satellite Account (2021–2023 and 2023–2025 releases)
Australia: Bureau of Communications, Arts and Regional Research, Cultural and Creative Activity in Australia (2020 and 2025 releases)
United Kingdom: DCMS Sectors Economic Estimates, Gross Value Added (2022 and 2023)
Indonesia: Ministry of Creative Economy and BPS, creative economy statistics (2025)